Exploring trends and investment opportunities in thematic indices
Thematic indices have seen a rise in popularity in recent years
But what are they and what is their purpose as an investment tool?
What thematic indices does XM offer?
Thematic indices are designed to capture trends arising from structural shifts within the technological, geopolitical and macroeconomic spheres that are often disruptive by nature. They range from environmental themes such as the push for clean energy, to healthcare sub-industries like biotechnology to relatively new concepts like the metaverse.
Each thematic index has its own set of rules and criteria for eligibility that best identifies that particular theme. They aim to measure the performance of companies being impacted by the same trend and so a thematic index can contain stocks belonging to multiple sectors but all sharing the same theme, unlike sectoral indices, which only represent companies that are within the same sector.
Another distinction between thematic indices and other investment products is that they are focused on future performance rather than past success. For example, an index consisting of companies involved in the manufacture of electrical vehicles (EV) will gauge the performance of the EV industry to identify investment opportunities in an emerging trend that has the potential to deliver future growth.
Tracking global equity trendsXM’s recently launched thematic indices incorporate six of the most trending themes at the moment: Artificial Intelligence Giants US Index (AI_INDX), Crypto 10 Index (Crypto_10), NFT and Blockchain Giants Index (Blockchain&NFT), China Internet Giants Index (ChinaInternet), FAANGs 10 Equally Weighted Index (FAANGs_10), and Electric Vehicles UST Index (ElectricVehicles).
AI mania is backAs the name suggests, the Artificial Intelligence Giants US Index is composed of some of the biggest names caught up in the year-long AI mania in the United States. Its constituents include the current AI champion Nvidia, as well as smaller software firms such as C3.ai and Sprinklr.
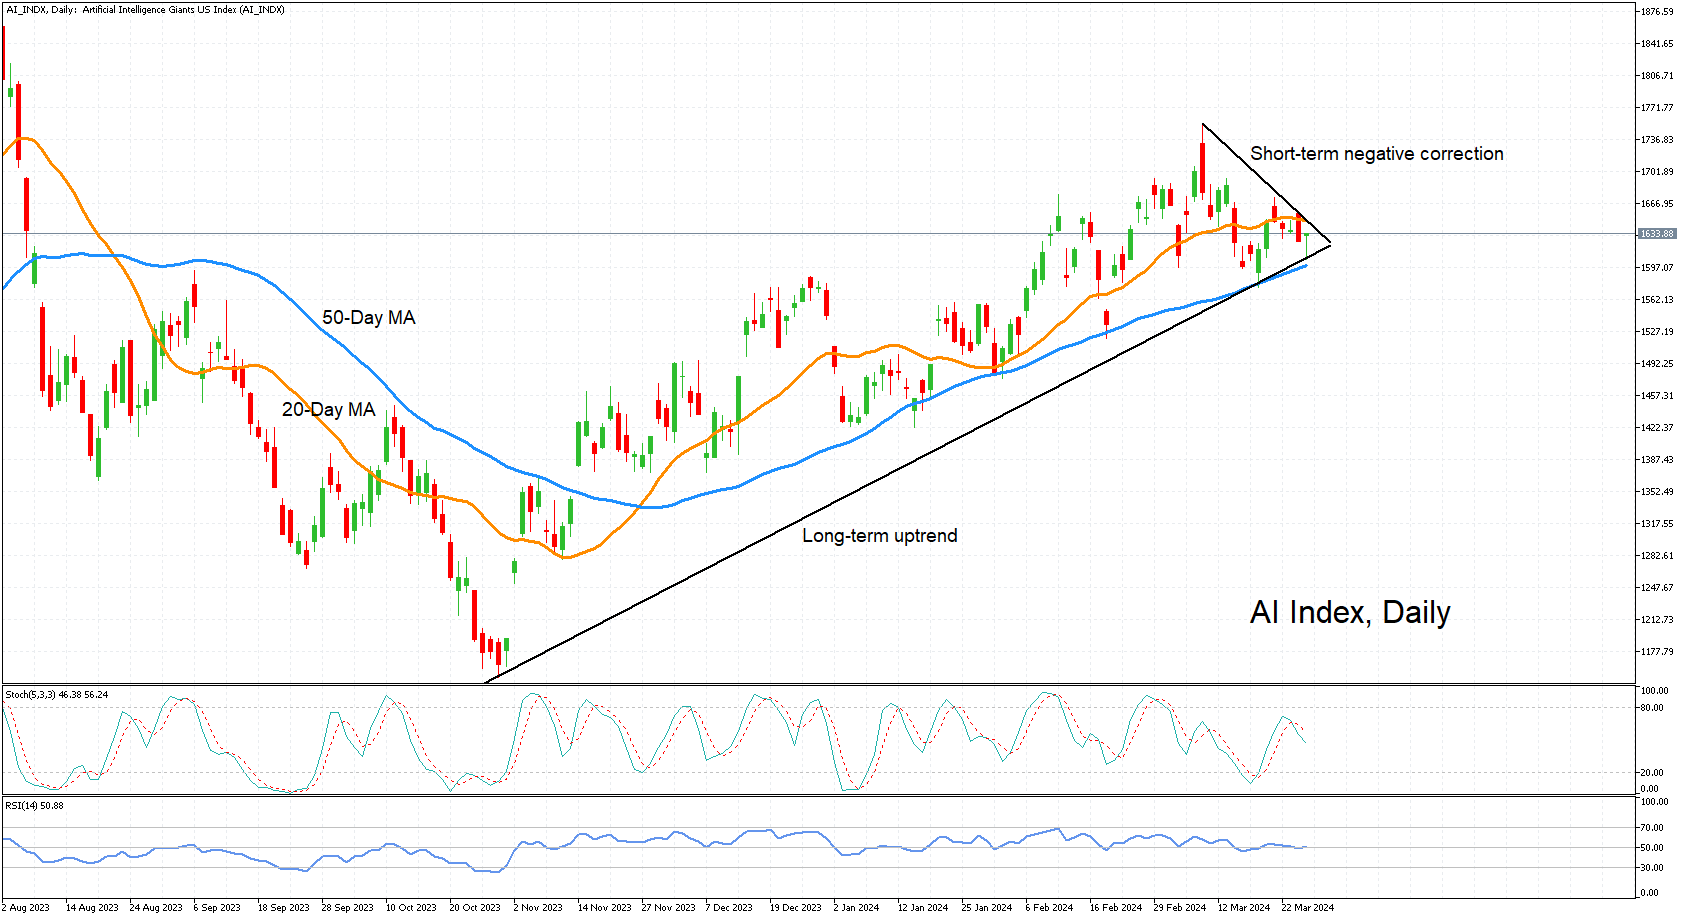
The AI index had year-to-date gains of 6.1% as of March 27, 2024, and a 12-month return of 58.6%. From a technical perspective, the index has been in an uptrend since October 2023, reaching a high of 1,732.38 on March 8, 2024. It then entered a corrective downtrend, finding support in its 50-day moving average (MA). As long as the price remains above the 50-day MA and the ascending trendline, an upside breakout is possible.
Tech dominationNot to leave out the other big tech firms that don’t make it to the AI list, the FAANGs 10 Equally Weighted Index is ideal for investors seeking a return on the 10 most traded companies on the Nasdaq. The index includes Apple, Microsoft, Google parent Alphabet and Netflix.
In the year-to-date, the index has rallied 19.8%, which extends to 74.0% in the last 12 months. The index has staged an impressive rebound from the lows of December. However, there’s been a mild pullback during March, which seems to be merely a technical correction at this point as the price is being heavily defended by the 20-day MA. Should it manage to hold above the 20-day MA, there is a decent prospect of a continuation of this bullish trend.
 Cryptos have skyrocketed over the past year
The Crypto 10 Index is a crypto-focused index made up of 10 of the leading digital coins and blockchain platforms. Bitcoin is the star of the index and Ethereum, Dogecoin, Solana and Polkadot are some of the other names featured. Given all the buzz surrounding the approval of spot Bitcoin ETFs, it shouldn’t come as too much of a surprise that the index has notched up year-to-date gains of 58.6% as of March 27, 2024, while its return over the past year amounts to an astonishing 147.6%.
In a slightly different themed index, the NFT and Blockchain Giants Index covers companies with some form of exposure to the broader crypto space, specifically, blockchain and non-fungible tokens (NFT). Its constituents include Coinbase Global, IBM, Nike, Robinhood, as well as Tesla and eBay.
The index has risen 15.0% so far this year and has surged by almost 100% over the past year.
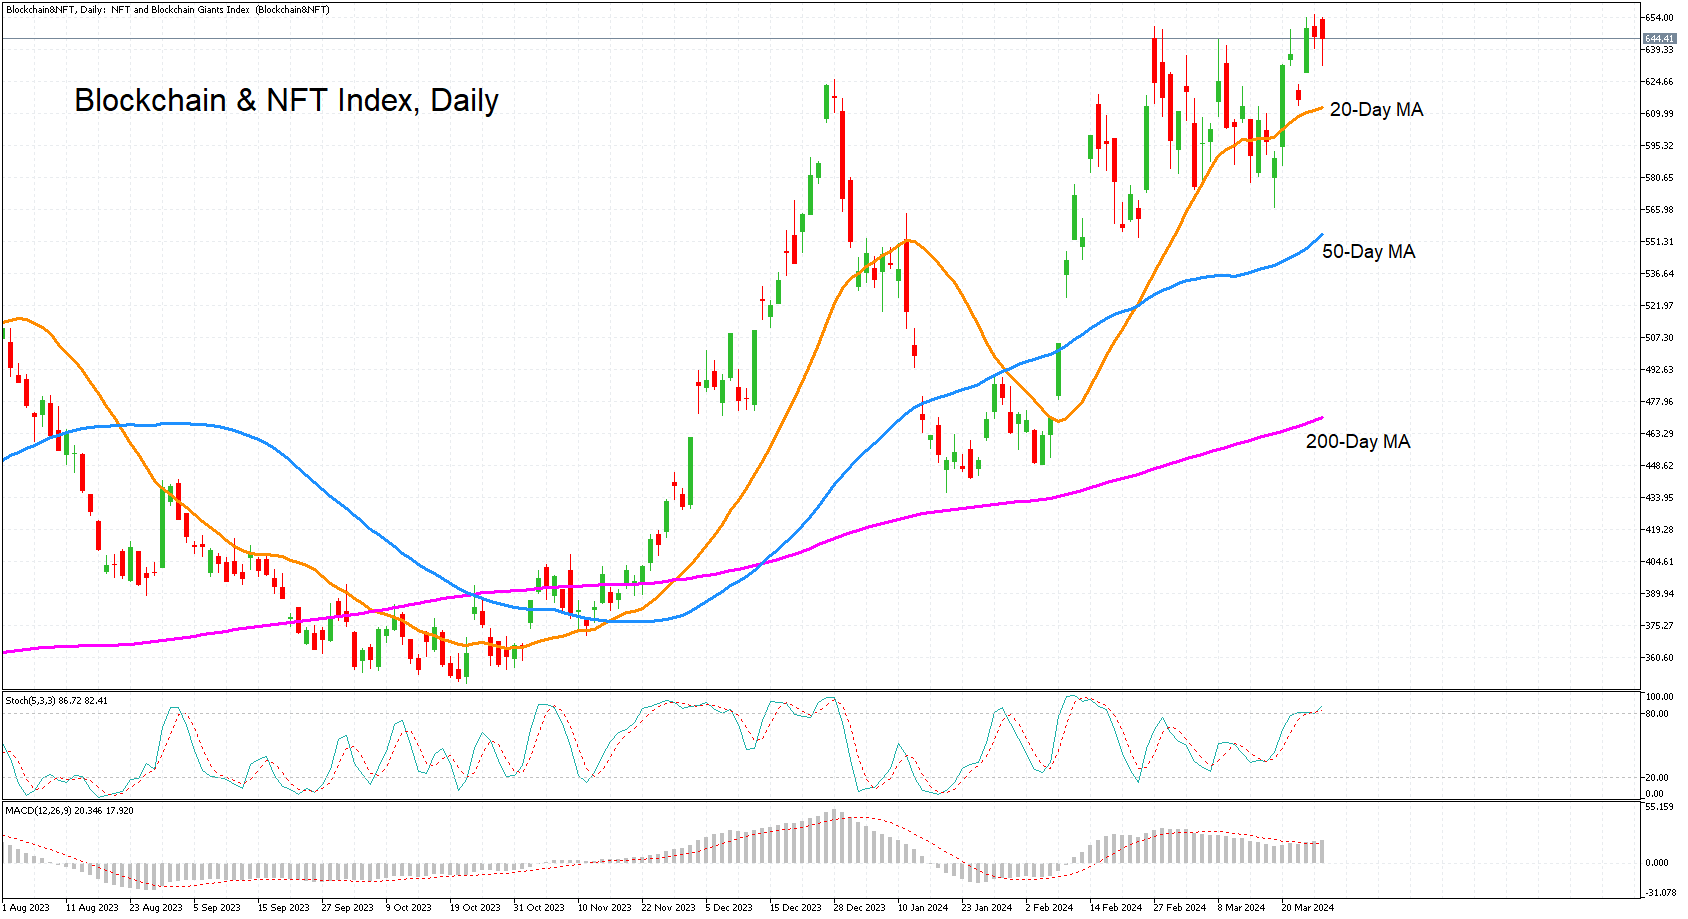
After a strong rally at the start of the year, the index retreated during February and March before marching higher again. But the momentum indicators point to some overbought conditions in the short term. In the longer-term, the index’s bullish structure looks solid, supported by the positively aligned 50- and 200-day MAs.
China’s Internet giantsWhen it comes to the tech scene, American tech and AI behemoths tend to dominate the headlines. But China has a number of dynamic tech giants of its own, such as Alibaba, Baidu, JD.com and Tencent. The China Internet Giants Index comprises the 30 largest of these companies that are dual listed in the US.
When it comes to share price performance, however, even Chinese tech firms haven’t been immune to the domestic stock market slump. The index has declined by 46.5% over the past three years, but the downtrend has started to ease as it’s only lost 1.2% in the year-to-date.

The index’s technical picture in the short-to-medium term is strongly bullish. But overcoming the longer-term descending trendline is proving challenging. Until there’s been a convincing break above the downtrend line, it cannot be said with confidence that the current upswing is sustainable.
Is the EV boom over?Another trend that is hard to miss lately is the growth in electric vehicles (EV). The race to cut carbon emissions amid the push by governments to tackle global warming has spurred sales of Battery Electric Vehicles (BEV) and Plug-in Hybrids (PHEV) around the world. Although sales over the past year have started to moderate, there is little to suggest that this slowdown will be permanent and most expect the EV market to balloon in the coming years.
The Electric Vehicles UST Index covers not just EV makers, but also those companies that supply parts, such as batteries. Tesla is the most prominent name in the index and other companies include the Lion Electric Company and Rivian Automotive.

With doubts about Tesla’s growth prospects weighing on its stock, the index heavyweight has been a significant drag on the EV index, which has lost 21.2% this year and about 78.5% in the last three years.
The present downtrend has been in place since August 2023 and the price is currently below all its moving averages. For the bearish outlook to shift to a more positive one, the first tentative sign could come from a climb above the 730 resistance, after which attention would turn to the 200-day MA, which coincides with the lows from April and May 2023.
Making wavesWith the above indices managing to capture some of the most important themes that are currently making the biggest waves in the markets, their usefulness as alternative investment products are evident. This top-down investing doesn’t come without risks, however. One danger is that thematic indices are very susceptible to changes in macroeconomic and geopolitical trends that tend to be more unpredictable.
Nevertheless, they serve a clear purpose within the investing world, allowing traders to jump on new trends as they appear.Related Assets
Latest News
Disclaimer: The XM Group entities provide execution-only service and access to our Online Trading Facility, permitting a person to view and/or use the content available on or via the website, is not intended to change or expand on this, nor does it change or expand on this. Such access and use are always subject to: (i) Terms and Conditions; (ii) Risk Warnings; and (iii) Full Disclaimer. Such content is therefore provided as no more than general information. Particularly, please be aware that the contents of our Online Trading Facility are neither a solicitation, nor an offer to enter any transactions on the financial markets. Trading on any financial market involves a significant level of risk to your capital.
All material published on our Online Trading Facility is intended for educational/informational purposes only, and does not contain – nor should it be considered as containing – financial, investment tax or trading advice and recommendations; or a record of our trading prices; or an offer of, or solicitation for, a transaction in any financial instruments; or unsolicited financial promotions to you.
Any third-party content, as well as content prepared by XM, such as: opinions, news, research, analyses, prices and other information or links to third-party sites contained on this website are provided on an “as-is” basis, as general market commentary, and do not constitute investment advice. To the extent that any content is construed as investment research, you must note and accept that the content was not intended to and has not been prepared in accordance with legal requirements designed to promote the independence of investment research and as such, it would be considered as marketing communication under the relevant laws and regulations. Please ensure that you have read and understood our Notification on Non-Independent Investment. Research and Risk Warning concerning the foregoing information, which can be accessed here.